

Wall Street experienced one of its most severe technology-driven selloffs in recent years on Thursday, November 5, as the Nasdaq Composite plunged 5.52% and investors reassessed the enormous financial expectations surrounding artificial intelligence infrastructure.
The Nasdaq Composite closed at 24,315.00, losing 1,421.51 points in a single trading session. The decline was its steepest since April 2025 and pushed the technology-heavy index into correction territory, more than 10% below its October 6 record.
The selloff erased an estimated $2.5 trillion in market capitalization from the Nasdaq-100, according to Reuters, as semiconductor manufacturers, cloud infrastructure companies, and major technology stocks suffered substantial losses.
Nvidia declined approximately 9.3%, Advanced Micro Devices fell more than 17%, and the Philadelphia Semiconductor Index dropped approximately 12.2%.
The downturn spread beyond artificial intelligence companies. The S&P 500 recorded its worst session since April 2025, while the Dow Jones Industrial Average lost more than 1,800 points.
Investors were responding to a combination of concerns involving AI infrastructure spending, semiconductor earnings, expensive technology valuations, and the potential for additional political scrutiny of data-center construction following the November 3 U.S. midterm elections.
The Reuters analysis of the November 5 technology selloff described a market increasingly concerned about whether the rapid expansion of artificial intelligence infrastructure can continue at its previously anticipated pace.
The historic decline raises questions about the sustainability of AI-related valuations, the financial exposure of technology companies, and the broader consequences of concentrated investment in a small group of influential stocks.
Nasdaq Falls 5.52% As Wall Street Records Historic Losses
The November 5 session produced substantial losses across all four major U.S. stock market benchmarks.
The Nasdaq Composite suffered the largest percentage decline among the major indexes, reflecting its considerable exposure to technology and semiconductor companies.
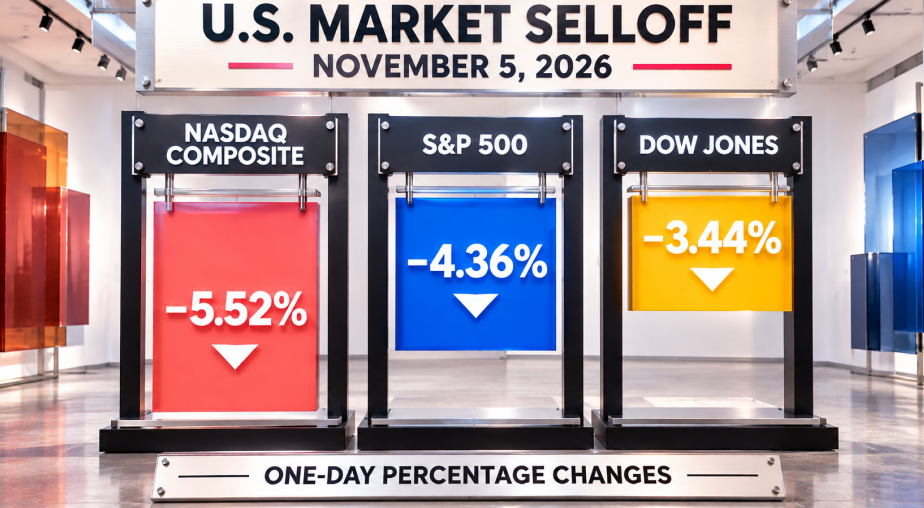
The S&P 500 declined 4.36%, while the Dow Jones Industrial Average dropped 3.44%.
Small-cap companies also experienced significant selling pressure, with the Russell 2000 falling approximately 4.45%.
| U.S. Market Index | November 5 Closing Level | Daily Decline | Percentage Loss |
|---|---|---|---|
| Nasdaq Composite | 24,315.00 | 1,421.51 points | 5.52% |
| S&P 500 | 7,353.73 | 334.89 points | 4.36% |
| Dow Jones Industrial Average | 51,523.06 | 1,833.06 points | 3.44% |
| Russell 2000 | 2,729.89 | Approximately 127 points | Approximately 4.45% |
Source: November 5, 2026, closing market data reported by the Associated Press and financial market reporting services.
The Nasdaq’s decline was particularly significant because it confirmed a market correction.
A correction generally refers to a decline of at least 10% from a recent market peak. It does not automatically indicate that an economy has entered a recession or that a prolonged bear market will follow.
The Nasdaq had reached a record closing high on October 6, 2026. By November 5, the index had fallen more than 10% from that level.
The day’s losses also reversed the gains recorded during the previous trading session, when markets initially responded positively to the midterm election results.
According to the Associated Press market report, all four major indexes remained positive for the year despite the sharp decline.
That distinction is important.
November 5 represented an exceptionally severe trading session, but it did not erase every gain accumulated by the broader U.S. stock market during 2026.
What The $2.5 Trillion Nasdaq Market Loss Actually Means
The estimated $2.5 trillion loss represents a decline in the combined market capitalization of major Nasdaq-listed companies.
Market capitalization is calculated by multiplying a company’s share price by the number of shares outstanding.
When share prices decline, the company’s market value decreases accordingly.
However, the reported $2.5 trillion does not mean that investors collectively withdrew that amount of cash from brokerage accounts or that companies directly lost $2.5 trillion in operating revenue.
Instead, it measures the reduction in the market’s valuation of the affected companies.
Reuters attributed approximately $2.5 trillion in erased market value to the Nasdaq-100, which tracks 100 of the largest nonfinancial companies listed on the Nasdaq exchange.
The broader Nasdaq Composite contains thousands of securities and uses a different index methodology.
Although the two indexes experienced the same general selloff, their percentage changes and market-capitalization calculations should not be treated as interchangeable.
This distinction matters because the scale of a market decline can be described through several different measurements.
An index’s point loss indicates how far its numerical level moved.
Its percentage decline measures the change relative to its previous closing value.
A market-capitalization loss estimates how much the collective valuation of its constituent companies decreased.
The Nasdaq’s 5.52% decline and the approximately $2.5 trillion Nasdaq-100 valuation loss therefore describe related but different aspects of the same market event.
Nvidia, AMD And Semiconductor Stocks Lead The Collapse
Semiconductor companies were among the hardest-hit businesses during the November 5 selloff.
The Philadelphia Semiconductor Index, which tracks major companies involved in semiconductor design, manufacturing, and related technologies, declined approximately 12.2%.
It was the index’s largest one-day decline since April 2025.
Nvidia, one of the most influential companies in the artificial intelligence infrastructure market, lost approximately 9.3% of its share value.
Advanced Micro Devices declined approximately 17.3%, while Micron Technology fell approximately 17.5%.
Broadcom also experienced a substantial decline, losing approximately 10.4%.
These companies occupy different positions within the semiconductor industry, but they share exposure to expectations about computing demand, data-center investment, and the future expansion of artificial intelligence.
Nvidia supplies graphics processing units widely used for training and operating advanced AI models.
AMD competes in processors and AI accelerators, while Micron manufactures memory products used across computing and data-center infrastructure.
Broadcom provides semiconductor and networking technologies that support large-scale computing systems.
The selling pressure reflected concerns about whether future demand and infrastructure spending would justify the valuations assigned to these businesses.
The Reuters report on global semiconductor losses also identified disappointing Qualcomm earnings and uncertainty surrounding future AI infrastructure investment as contributing factors.
A major decline in semiconductor stocks can have an outsized effect on market indexes because several chipmakers carry substantial market capitalizations.
Their movements can therefore influence the performance of the Nasdaq and S&P 500 even when other sectors experience smaller losses.
Why Artificial Intelligence Stocks Suddenly Faced Selling Pressure
The November 5 selloff developed against a backdrop of rising investor scrutiny over the financial assumptions supporting artificial intelligence expansion.
Technology companies have committed substantial resources to data centers, specialized processors, networking equipment, energy infrastructure, and other systems required to develop and operate advanced AI services.
Investors have generally viewed these expenditures as necessary to support future demand.
However, the scale of planned investment has also created uncertainty about when the resulting infrastructure will generate sufficient revenue to justify its cost.
A company may experience rapid sales growth while still facing concerns about capital expenditure, financing requirements, operating margins, or the timing of future profitability.
These questions become particularly important when share prices already reflect expectations of sustained expansion.
The November 3 midterm elections added another source of uncertainty.
Democratic gains in Congress and state-level political contests prompted market speculation that proposed data-center developments could face greater scrutiny.
Concerns involved electricity consumption, water demand, local infrastructure requirements, and the potential effects of large facilities on surrounding communities.
Some investors interpreted the political changes as a possible obstacle to the speed of future data-center construction.
However, the election results did not establish that all proposed AI infrastructure projects would be delayed or canceled.
The market reaction reflected expectations and uncertainty about future policy decisions, rather than a single nationwide prohibition on data-center development.
Michael O’Rourke, chief market strategist at JonesTrading in Stamford, Connecticut, identified the potential slowdown in data-center construction as an important emerging market concern in Reuters’ coverage.
The distinction between anticipated regulation and enacted policy remains essential when assessing the reasons behind the selloff.
Data-Center Expansion Becomes A Major Market Concern
The relationship between artificial intelligence companies and physical infrastructure has become increasingly important to investors.
AI development requires substantial computing capacity, which depends on data centers equipped with specialized hardware, networking systems, cooling equipment, and reliable electricity supplies.
Building these facilities involves significant capital investment and often requires coordination with utilities, local governments, construction companies, and technology suppliers.
As proposed facilities become larger, their potential effects on regional power systems and water resources have attracted additional public attention.
Local opposition can influence permitting decisions, construction schedules, and infrastructure costs.
Those factors can affect companies involved in supplying chips, building data centers, developing power infrastructure, and financing technology projects.
The November 5 selloff illustrated how investors may react when assumptions about future construction schedules change.
A slower development timetable could affect anticipated semiconductor orders or delay revenue associated with new computing facilities.
However, the consequences would vary among companies.
Some businesses may have substantial existing contracts, diversified customer bases, or alternative sources of demand.
Others may depend more heavily on financing conditions or the timely completion of proposed infrastructure projects.
The market’s broad reaction therefore does not establish that every AI-related company faces the same financial risks.
It does demonstrate how expectations about one industry can influence valuations across several connected sectors.
S&P 500 And Dow Jones Losses Show Broader Market Weakness
Although semiconductor companies experienced some of the most dramatic declines, the November 5 selloff was not limited to technology.
All 11 sectors of the S&P 500 finished lower.
Seven sectors declined by at least 2%, demonstrating that selling pressure extended across much of the U.S. equity market.
The Dow Jones Industrial Average lost 1,833 points, one of its most substantial recent single-session point declines.
Major companies outside the semiconductor industry also experienced losses.
Caterpillar declined approximately 6.4%, while JPMorgan Chase fell approximately 4.2%.
UnitedHealth Group and 3M each lost more than 3%.
These movements suggest that investors were reassessing broader market exposure rather than exclusively selling semiconductor shares.
However, the magnitude of the decline varied by sector.
Technology companies experienced especially severe losses, while traditionally defensive areas such as utilities and consumer staples generally declined less sharply.
The Wall Street Journal’s November 5 market coverage described a broad-based retreat driven by concerns about AI investment and data-center construction.
The widespread decline also illustrates how concentrated market leadership can influence broader investor sentiment.
When heavily weighted technology companies lose value rapidly, their effect on major benchmarks can create the impression of a market-wide crisis even when some businesses remain comparatively resilient.
How The November 2026 Selloff Compares With Previous Market Crashes
The November 5 decline was historically significant, but it should be distinguished from the largest market crashes in U.S. history.
The Nasdaq’s 5.52% loss represented its worst session since April 2025.
That earlier period followed the announcement of sweeping U.S. tariffs and substantial uncertainty about international trade policy.

The November 2026 downturn involved a different combination of concerns, centered on AI infrastructure investment, technology valuations, and potential regulatory changes.
Other historic market disruptions provide additional context.
During the March 2020 COVID-19 market crisis, U.S. indexes experienced multiple exceptionally large daily declines as investors reacted to the economic consequences of the pandemic.
The 2008 global financial crisis involved severe stress in banking, credit markets, and financial institutions.
The October 1987 stock market crash remains notable for the Dow Jones Industrial Average’s extraordinary one-day percentage decline of approximately 22.6%.
The November 2026 selloff was substantial, but its causes and scale should not automatically be equated with those events.
A sharp market decline can occur without a banking crisis, a recession, or a prolonged collapse in economic activity.
Determining whether the latest downturn develops into a more persistent market disruption requires additional evidence about corporate earnings, financing conditions, economic activity, and investor behavior.
Volatility Surges As Investors Reassess Market Risk
The rapid decline in U.S. equities was accompanied by a substantial increase in market volatility.
The Cboe Volatility Index, commonly called the VIX, rose sharply during the November 5 session.
The VIX reflects expectations of near-term S&P 500 volatility derived from options prices.
It is sometimes described as Wall Street’s fear gauge, although it measures expected market fluctuations rather than investor emotions directly.
A rising VIX indicates that options markets are pricing greater uncertainty about future movements in the S&P 500.
The index closed around 27.36 on November 5, reflecting a considerable increase from the previous session.
At the same time, demand for U.S. Treasury securities increased, contributing to lower government bond yields.
The benchmark 10-year Treasury yield moved to approximately 4.84%.

Bond prices and yields generally move in opposite directions, meaning that stronger demand for existing Treasury securities can push their yields lower.
These developments suggest that investors were reducing exposure to certain risk-sensitive assets while reassessing their portfolios.
Nevertheless, a rise in volatility does not establish the direction of future stock prices.
Volatility can remain elevated during both continued declines and sharp recoveries.
What The Stock Market Crash Means For Prediction Markets And Betting Platforms
Although the November 5 downturn primarily concerns financial markets, it also provides relevant context for the growing discussion surrounding prediction markets and event-based trading platforms.
Traditional sportsbooks offer wagers on sporting events and other permitted betting markets under applicable gambling regulations.
Prediction-market platforms may offer contracts tied to financial, economic, political, or other events, depending on the platform and its regulatory status.
These products are not necessarily governed by the same rules.
In the United States, the Commodity Futures Trading Commission oversees certain derivatives markets, while state gaming regulators supervise licensed gambling activity within their jurisdictions.
The distinction has become increasingly important as prediction-market operators and state regulators dispute the classification of some event contracts.
Financial-market volatility may increase public attention toward contracts involving economic outcomes, but it does not establish that prediction-market activity increased during the November 5 selloff.
No verified figures in the available reporting demonstrate a direct increase in prediction-market trading volume attributable to the Nasdaq decline.
The market event instead highlights the importance of understanding the different financial risks, settlement structures, and regulatory protections associated with investment products and event-based contracts.
Unlike conventional stock ownership, an event contract may settle according to whether a specified condition occurs.
That distinction affects how users evaluate potential losses, contractual terms, and the circumstances under which a position can expire without value.
The Nasdaq selloff therefore provides a useful example of why financial-market news and betting-market commentary require different analytical frameworks.
Could The Nasdaq Recover After The $2.5 Trillion Selloff?
The November 5 decline does not establish whether the Nasdaq will recover quickly, remain volatile, or experience further losses.
Market performance will depend on developments that cannot be determined from a single trading session.
Corporate earnings remain particularly important.
Investors will continue examining whether AI-related businesses can translate substantial infrastructure investment into sustainable revenue and profitability.
Technology companies’ capital expenditure plans will also receive attention.
Changes in data-center construction schedules, financing costs, semiconductor demand, and regulatory requirements could influence future expectations.
Political developments may affect sentiment, particularly if proposed restrictions on data-center projects advance into specific legislation or local permitting decisions.
However, policy announcements must be evaluated individually rather than interpreted as evidence of a uniform national approach.
The November 5 selloff also occurred while major U.S. indexes remained positive for 2026.
According to the Associated Press, the Nasdaq was still approximately 4.6% higher for the year, while the S&P 500 retained a gain of approximately 7.4%.
These figures provide context for the scale of the recent correction.
They do not guarantee that the remaining annual gains will persist.
The coming trading sessions will offer more evidence about whether selling pressure remains concentrated in AI-related businesses or spreads further into the broader economy.
What November’s Historic Nasdaq Loss Reveals About The AI Investment Boom
The approximately $2.5 trillion Nasdaq-100 market-value decline illustrates how strongly financial markets have become connected to expectations surrounding artificial intelligence.
AI-related businesses have attracted substantial investment because of their potential to transform computing, software, manufacturing, research, and other industries.
However, expectations about future technological development are not equivalent to realized financial returns.
Companies must still demonstrate that their products, infrastructure, and business models can support the valuations investors assign to them.
The November 5 selloff exposed the sensitivity of those valuations to changes in assumptions about spending, regulation, financing, and future demand.
Nvidia’s decline, the semiconductor industry’s sharp losses, and the broader retreat in U.S. equities demonstrated that uncertainty in one influential sector can affect the entire market.
For financial-market observers, the most important development is not simply the extraordinary dollar value erased during a single session.
It is the growing importance of distinguishing between the long-term potential of artificial intelligence and the financial performance required to support current investment expectations.
As Wall Street evaluates the consequences of the November 2026 selloff, corporate earnings, infrastructure spending, regulatory developments, and market volatility will remain central to understanding the next phase of the AI investment cycle.