

Sports bettors face three primary markets when analyzing a game: the moneyline, the point spread, and the total. Each format asks a distinct question about the event. One focuses strictly on who wins. Another measures the exact margin of victory. The third evaluates the overall scoring pace.
Learning how sportsbooks price these options separates casual fans from serious players. Bookmakers shape these lines to balance financial liability. Professional bettors analyze the same lines to locate pricing errors. You need a clear strategy to evaluate which market offers the highest probability of a profitable return.
The Moneyline: Betting On The Outright Winner
The moneyline is the simplest wager available. You pick the team you expect to win the match outright. The final score means nothing. The margin of victory carries no weight. If the team you select wins the game, your ticket cashes.
Bookmakers use varied odds to balance the difference in team strength. Heavy favorites offer small payouts. Major underdogs offer significant returns. A bettor taking a massive favorite risks a large amount of capital for a minimal reward. A bettor backing a severe underdog risks a small amount for a massive payout.
You must know exactly how decimal odds work to calculate your potential profit and implied probability accurately. Without that math, you are guessing blindly at the betting window.
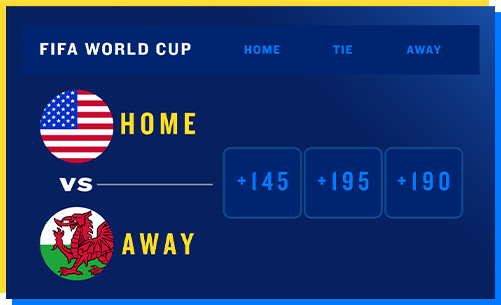
Bettors transitioning from global soccer formats notice immediate similarities here. The American moneyline functions much like a standard European format, minus the constant threat of a tie. You can read more about what the 1X2 market means to see how European books handle three possible outcomes in regular time.
The Point Spread: Betting On The Margin Of Victory
The point spread acts as a mathematical equalizer. Sportsbooks assign a handicap to both teams to create a theoretically even matchup. The favorite must win the game by a specific number of points. The underdog must either win outright or lose by fewer points than the assigned number.
This market demands deeper analysis than picking a straight winner. A dominant team might easily win the game but fail to cover a massive spread. A terrible team might lose every week but consistently cover the number by keeping games close until the final whistle.
Bettors find an edge here by identifying situational advantages. Weather conditions, travel fatigue, and injury reports shift the true margin of a game. A sharp bettor capitalizes when the sportsbook sets the handicap too high or too low based on public perception. You can find historical spread data on statistical platforms like TeamRankings to track how often specific franchises meet market expectations over a multi-year sample size.
| Market Type | Team | Spread | Required Result to Win Bet |
| Favorite | Team A | -7.5 | Must win by 8 points or more |
| Underdog | Team B | +7.5 | Must win outright, or lose by 7 points or fewer |
Sportsbooks move the point spread throughout the week. Public betting volume forces bookmakers to adjust the number to balance their financial exposure. A line might open at -3 on Monday and close at -4.5 by Sunday. Catching the best possible number dictates long-term profitability.
The Total (Over/Under): Betting On Combined Points
The total ignores the game’s winner entirely. Bookmakers set a projected number of combined points scored by both teams. You wager on whether the final score will land over or under that exact number.
This market requires evaluating tempo, offensive efficiency, and defensive strength. A game featuring two fast-paced offenses usually commands a high total. A matchup between two defensive-minded squads results in a low total.
Bettors often use advanced pace metrics from sites like KenPom to project game flow in college basketball. Analytics provide a clearer picture than simply looking at basic scoring averages. You compare your projected score against the sportsbook’s number.
Referees influence totals heavily. Certain officials call more penalties, extending drives and creating scoring opportunities. Stadium design impacts the game. Domes guarantee perfect conditions, favoring offensive execution. Open-air stadiums expose games to wind, rain, and snow, suppressing scoring.
If the bookmaker lists the total at 45.5, and your model projects exactly 40 points, you place a wager on the under. You are seeking mathematical discrepancies in the market. This exact process defines value betting for professional syndicates.
| Wager Type | Listed Total | Final Combined Score | Bet Result |
| Over | 45.5 | 48 (Example: 27-21) | Win |
| Under | 45.5 | 42 (Example: 24-18) | Win |
Choosing The Right Market For Your Strategy
No single market is inherently superior. Sharp bettors analyze the moneyline, the point spread, and the total for every single game. They look for the specific line offering the best mathematical advantage.
Sometimes the moneyline presents a massive pricing error on a live underdog. Other times, the spread accurately reflects the game, but the total completely ignores severe weather forecasts. Your job is to find the weak number.
You must compare prices across multiple sportsbooks to guarantee the highest possible return on your wagers. Using an odds comparison tool helps identify the most favorable numbers available in real-time. Taking a bad price destroys your edge over a long season.
Quick Reference Table
| Market | Core Concept | What You Need To Happen |
| Moneyline | Outright Winner | Your selected team wins the game outright. |
| Point Spread | Margin of Victory | Your team covers the assigned handicap number. |
| Total (Over/Under) | Combined Scoring | The final combined score goes over or under the listed line. |