

Betting based on gut feelings is like trusting a Magic 8-Ball for money advice. I’ve seen many bankrolls vanish like magic. That hopeful feeling? It often helps the sportsbooks grow their vacation funds.
Winning bets need careful research, like a sports anthropologist studying team dynamics. We should analyze recent performances like a film critic. And interpret stats like a data scientist.
This isn’t about finding divine inspiration. It’s about knowing why you’re betting, not just because “the colors look nice today.” True pre-bet research involves looking at player form, injuries, and trends like a detective.
Move from a hopeful gambler to a smart bettor. If you’re not doing the research, you’re just helping the house win. And they already have plenty of beach houses.
Reliable Data Sources
Finding trustworthy sports data is like searching for an honest politician in Washington. It’s possible but needs expert-level discernment. The internet is full of statistics, but not all are reliable. Some sites offer data as trustworthy as a Florida weather forecast.
Your betting success depends on the quality of your data. Bad data leads to bad bets. That’s why I’ve found reliable platforms that filter out the noise.
LiveScore is like that friend who knows everyone’s business. It offers complete coverage across leagues with good historical data. It’s great for getting the big picture before diving deeper.
Flashscore gives real-time updates faster than Twitter during a celebrity meltdown. It’s perfect for knowing about injuries or substitutions immediately. Their mobile app is great for updates on the go.
SofaScore is the analytics nerd at the party. It offers advanced stats like xG metrics. It’s perfect for serious betters who love detailed analysis.
WhoScored adds the secret sauce with expected goals (xG) data. This data shows a team’s true performance beyond the scoreline. It’s like having X-ray vision into a team’s capabilities.
But, never trust just one source. I check these platforms like a fact-checker at the New York Times. When all agree, I know it’s true. When they don’t, I dig deeper.
The table below shows how these platforms compare for serious team analysis:
| Platform | Real-time Speed | Analytics Depth | Historical Data | Mobile Experience |
|---|---|---|---|---|
| LiveScore | Good | Moderate | Extensive | Solid |
| Flashscore | Excellent | Basic | Limited | Outstanding |
| SofaScore | Very Good | Advanced | Comprehensive | Excellent |
| WhoScored | Good | Specialized (xG) | Deep | Good |
Building your data ecosystem requires knowing each platform’s strengths. It’s like assembling a superhero team. Each member has unique powers for the mission. Flashscore for speed, SofaScore for depth, WhoScored for specialized insights, and LiveScore for breadth.
The ultimate goal is to create a verification system that NASA engineers would approve of. When your sources align, you can bet with confidence. That’s how you turn data into dollars.
Remember, quality team analysis starts with trusting your sources but verifying everything. It’s the difference between gambling and informed speculation. In this game, that distinction separates pros from amateurs.
Form, Fitness & Team News
Looking at recent results is just the start. To really understand, you need to dive into sports stats that show why teams win or lose.
Recent form isn’t just about counting wins. It’s about the context. That five-game winning streak? It might be against teams who’ve already given up. Or it could be real quality. You need to know the difference.
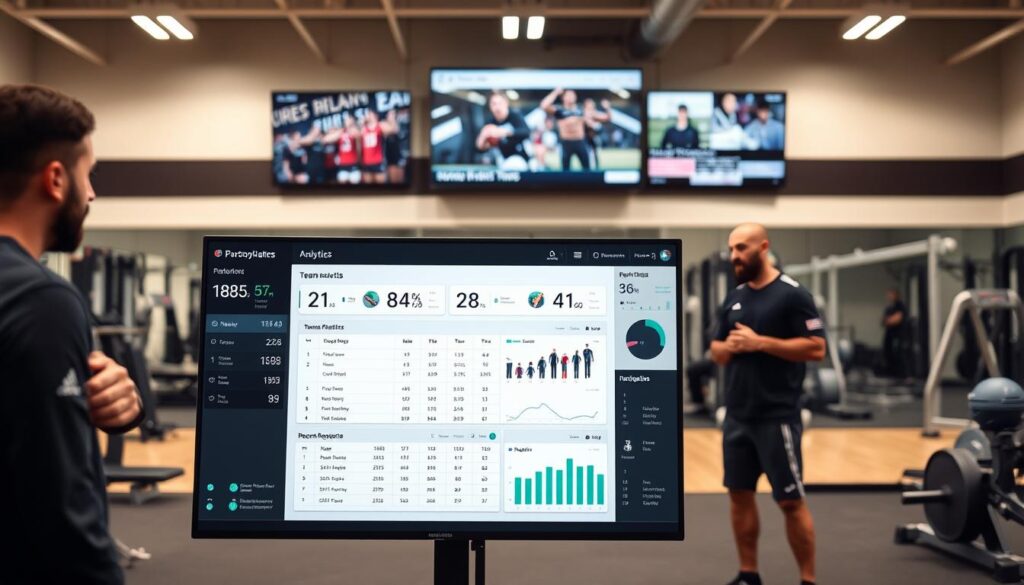
Home versus away performance is key. Some teams play like champions at home but poorly on the road. Others do better under pressure away from their fans. This makes sports stats analysis tricky.
Now, let’s talk about injuries and suspensions. That star striker with “food poisoning”? It’s often just a cover-up. These details are important. They can turn favorites into underdogs quickly.
Looking at player data reveals hidden truths. Expected Goals (xG) shows if a team’s scoring is based on skill or luck. Is that midfielder creating quality chances? Or just taking long shots?
| Factor | What to Analyze | Why It Matters |
|---|---|---|
| Recent Form | Last 5 games, quality of opponents | Shows current performance level, not season-long trends |
| Home/Away Splits | Performance differences by venue | Some teams transform completely on the road |
| Player Availability | Injuries, suspensions, international duty | One absent star can change everything |
| Advanced Metrics | xG, chance creation, defensive stats | Reveals underlying performance beyond basic results |
Fitness reports are gold mines. That key defender running at 80%? He might get torched by a fresh attacker. The goalkeeper with a sore shoulder? Crosses become adventure time.
Team news isn’t just about who’s playing. It’s about who’s not playing. And why. And how replacements change the dynamic. This sports stats deep dive separates smart money from hopeful guessing.
Good form analysis looks beyond the scoreboard. It asks how. It asks why. It wonders about that slight limp in the captain’s stride. These details make all the difference.
Your fitness and team news checklist should include:
- Starting lineup predictions 24 hours before match
- Injury reports from reliable team sources
- Training ground observations from local journalists
- Historical performance of replacement players
This isn’t just data collection. It’s detective work. The kind that turns sports stats into winning insights. Because sometimes the most important player is the one who isn’t there.
Key Stats to Analyze
Numbers can be tricky, but they tell the truth if you know how to read them. Think of stats as your decoder ring for sports betting. Without the right ones, you’re just guessing, while others are getting the full story.
Possession percentage might look good, but it’s not everything. A team can have 70% possession and lose 3-0. This happens when they pass sideways in their own half, like in a rec league.
Expected goals (xG) is where the magic happens. It shows if a team is making quality chances or just getting lucky. It’s the difference between a team that’s dangerous and one that looks good but isn’t.
Head-to-head records show psychological edges that last all season. Some teams just have another’s number, like a friend who always beats you at poker. These patterns often stay the same, even when teams change.
Here’s what really matters in your pre-bet research:
- Offensive/defensive efficiency (not just goals scored/conceded)
- Set-piece performance (corners, free kicks, penalties)
- Market-specific data (Over/Under, Both Teams to Score patterns)
- Discipline metrics (cards, fouls, suspensions)
Statistical models need specific data to work. You can’t just throw numbers at a wall and see what sticks. The best models use predictive metrics, not just descriptive ones.
Ask yourself: does this stat predict future outcomes? If not, it’s just trivia. A team’s average pass completion rate might be fun to talk about, but it won’t help you win bets.
Market-specific data is key. For corner bets, look at teams’ crossing and defensive setups. For card bets, understand referee tendencies and team discipline.
Remember, context is everything. A stat without context is misleading. The best pre-bet research uses many stats to paint a complete picture.
Don’t get stuck in analysis paralysis. You don’t need every stat – just the right ones. Quality is more important than quantity.
Weather, Venue, Trends
Weather and venue specifics are key factors that algorithms can’t fully grasp. Stats show what happened, but the environment explains why and what’s next. It’s like the difference between reading a weather forecast and being in the storm.
I learned this the hard way betting on an outdoor game. I analyzed every player statistic but forgot to check the weather. Hurricane-force winds made soccer players stumble. Watching them was like a Shakespearean tragedy with drunk college students.

Venue advantages give teams special powers. Some teams change completely based on where they play. The Denver Broncos get superpowers at Mile High Stadium because of the altitude. Other teams become better hitters in certain parks.
Looking at historical trends helps find real patterns. Does a team struggle against left-handed pitchers at night? Do they score more on artificial turf? We’re searching for trends that show real causes, not just chance.
| Environmental Factor | Impact Level | Key Considerations | Data Sources |
|---|---|---|---|
| Extreme Weather | High | Wind speed, precipitation, temperature extremes | National Weather Service, stadium-specific apps |
| Venue Type | Medium-High | Surface material, altitude, crowd capacity | Team archives, architectural specifications |
| Travel Factors | Medium | Time zone changes, flight duration, climate adjustment | Flight tracking data, team travel schedules |
| Historical Trends | Variable | Sample size, recent relevance, opposing matchups | Sports databases, historical weather archives |
Modern algorithms use these factors in complex calculations. They weigh weather, adjust for venue, and track trends. The best models analyze how environment affects teams.
Sports happen in real conditions, not labs. Weather can change favorites into underdogs quickly. Adding environmental factors to your analysis makes it much stronger.
Avoiding Info Overload
Some analysts track everything, from player zodiac signs to turf grass length. But smart money focuses on key factors that predict outcomes. Today, sports stats are everywhere, but only 20% of them really matter.
Watching brilliant minds turn into data hoarders is common. They miss obvious patterns while drowning in info. The trick is to curate your sources like a museum director, not a garage sale addict.
Your pre-match routine should be like a surgeon’s checklist. It’s focused, essential, and saves your bankroll. Here’s what really matters in sports stats:
| Essential Factor | What to Look For | Time Investment | Predictive Value |
|---|---|---|---|
| Recent Form (Last 5-10 games) | Trends, not single-game outliers | 15 minutes | High |
| Key Player Availability | Injuries, suspensions, roster changes | 10 minutes | Very High |
| Motivational Factors | Playoff implications, rivalry games | 5 minutes | Medium-High |
| Specific Matchup Advantages | Historical performance against opponent | 10 minutes | Medium |
| Venue & Conditions | Home/away splits, weather impacts | 5 minutes | Medium |
What’s missing? Coach’s college winning percentage, player social media, or uniform color win rates. They’re as predictive as reading tea leaves. Good sports stats analysis is about knowing what to exclude.
The “lucky” proposition trap is deadly. It’s about patterns like “Team A wins when it rains and the quarterback ate pancakes.” This isn’t analysis—it’s desperation. Real sports stats shows itself consistently, not magically.
Managing your analysis is like using a metal detector at the beach. You could dig up every metal piece, or focus on real treasure signals. The best analysts know when to stop researching.
My rule: If you can’t explain your reasoning in three clear points, you’ve over-complicated it. The market rewards clarity, not complexity. Your sports stats research should be sharp, not confusing.
Remember, more data doesn’t mean better decisions. It can lead to confusion. Pros have better filters, not more info. They use the right sports stats ingredients, not everything.
The goal isn’t to know everything. It’s to know enough to act confidently. Sometimes, the best move is to close your laptop and trust your work.
Conclusion: Smart Bets Start with Good Research
Let’s face it – no research can predict every outcome. ESPN stats and FiveThirtyEight algorithms can’t always get it right. But, the key is that pros at DraftKings bet on what’s likely to happen.
Your research turns gambling into a smart risk. It’s like moving from throwing darts to playing chess. By looking at form, injuries, and weather, you make informed choices, not just guesses.
This method makes watching sports even more fun. You’re not just watching games; you’re testing your theories. You become that friend who knows why the underdog might win. So, trust your research and remember: being smart beats being lucky every time.